Measure Your Heart Rate Using RC1
by asmaasalemea in Circuits > Sensors
362 Views, 2 Favorites, 0 Comments
Measure Your Heart Rate Using RC1

Topic:
Your heart is the important organ in your body, it is pump blood to each cell and organ in our body.
Why heart rate data are useful? Because it is helps us in your exercise routine, studying your activity or anxiety levels or just want your shirt/bracelet to blink with your heart beat.
Summary:
In this tutorial, you will build a simple measuring tool for your heart pulses.
The project will be used to measure the heart rate of the human.
Objectives:
- Understanding how we measure the heart pulse in our body.
- Learners will compare between displaying data and pulses of the normal person.
- Learners will build DIY finger-tip heart rate monitor.
Supplies


- TekTech RC1 + USB wire.
- Download APP (Windows Only).
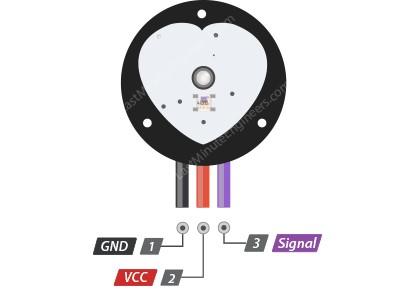
- heart rate (pulse) sensor.
Imagine It


How heart rate (pulse) sensor work?
A pulse sensor or any optical heart-rate sensor, for that matter, works by shining a green light on the finger and measuring the amount of reflected light using a photosensor.
The oxygenated hemoglobin in the arterial blood has the characteristic of absorbing green light. The redder the blood (the higher the hemoglobin), the more green light is absorbed. As the blood is pumped through the finger with each heartbeat, the amount of reflected light changes, creating a changing waveform at the output of the photosensor.
As you continue to shine light and take photosensor readings, you quickly start to get a heart-beat pulse reading.
- The heart rate returns measurements in BPM (beats per minute).
- A normal resting heart rate for adults ranges from 60 to 100 beats per minute.
Code


- showing your data on dashboard.
Build


- connect No1 in sensor with GND in RC1.
- connect No2 in sensor with 3.3 v or 5 v in RC1.
- the last pin in sensor (it is analog input) with input pins in RC1
Test It

Now test time, put your finger on the LED of the sensor and see your heart rate pulse on LCD of RC1.
Reflect on It
- make alarm when you received abnormal data on screen.
- draw a heart shape on screen beside your data.
- use a green light for normal data and red light for abnormal data.